Geology and Election 2000: Demographics
Steven Dutch, Professor Emeritus, Natural and Applied Sciences,Universityof Wisconsin - Green Bay
Comparison with the geologic maps shows that the pro-Gore band of countiescorresponds very closely with the units labeled uK - upper Cretaceous. Thecorrelation is strongest for Alabama, somewhat weaker in Mississippi. It is surprisingly evident in Georgia considering how narrow and discontinuous the outcrop band of Cretaceous rocks is there. But the correlation breaks down in South Carolina. Although the band of Democratic counties is well defined across South Carolina, it is consistently seaward of the Cretaceous rock units. In fact, on some maps there seems to be a weak anti-correlation between the Cretaceous rocks in South Carolina and the political and demographic trends noted for the other three states.
This band shows up with varying degrees of prominence for previous elections as well. It shows the same correlation with rock units in Mississippi, Alabama and Georgia and the same lack of correlation in South Carolina. Itfurther shows strong correlation with demographic trends.
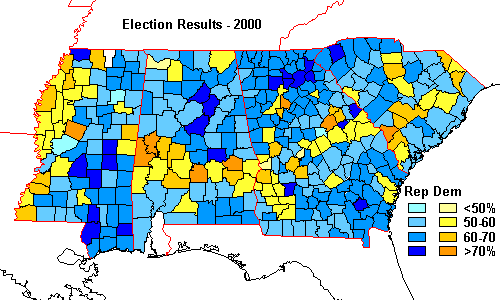 | On the map of electoral returns for the presidential election of 2000 is afeature instantly recognizable to a geologist: in the otherwise pro-Bush South,an arcuate band of pro-Gore counties sweeps from eastern Mississippi, acrossAlabama and Georgia and into the Carolinas A geologist finds this feature immediately familiar because it coincides almost exactly with a series of rock units on the Geologic Map of the United States. |
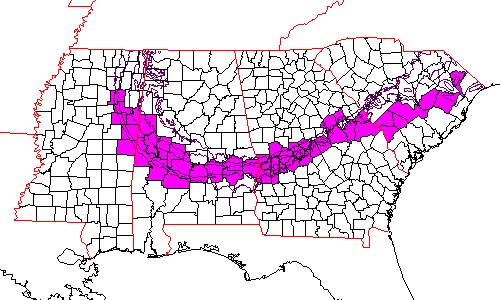 | The pro-democratic counties (with a few gaps filled) are shown here. |
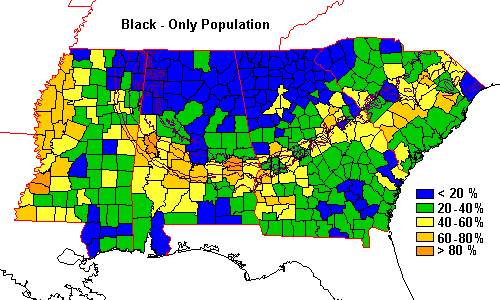 | Given the electoral patterns, the demographic trends of the region are very understandable. There is a pronounced arc of black population. Note that the band follows the Cretaceous rocks from Mississippi to Georgia but, like electoral trends, lies seaward of the band in South Carolina. |
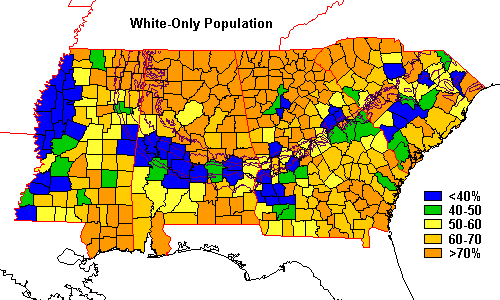 | The white population is essentially a mirror image of the black map. |
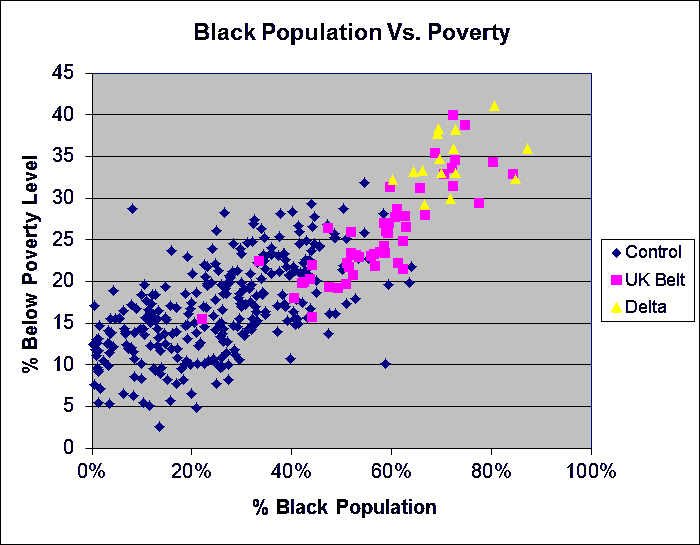
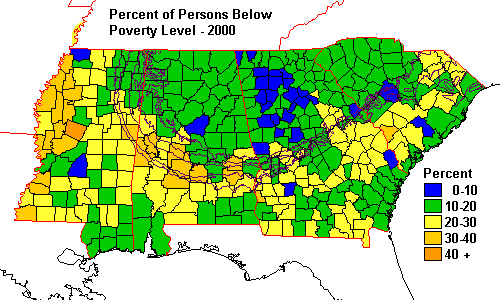 | And the arc shows up as a diffuse band of high poverty. |
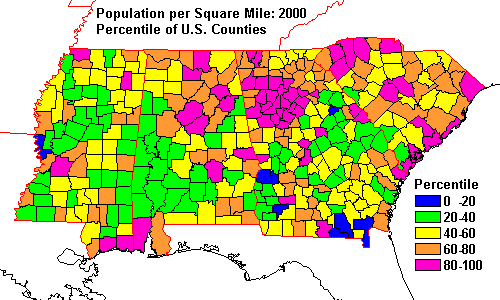 | Population density shows no correlation at all with the band. |
 | |
 | |
Statistical Analysis
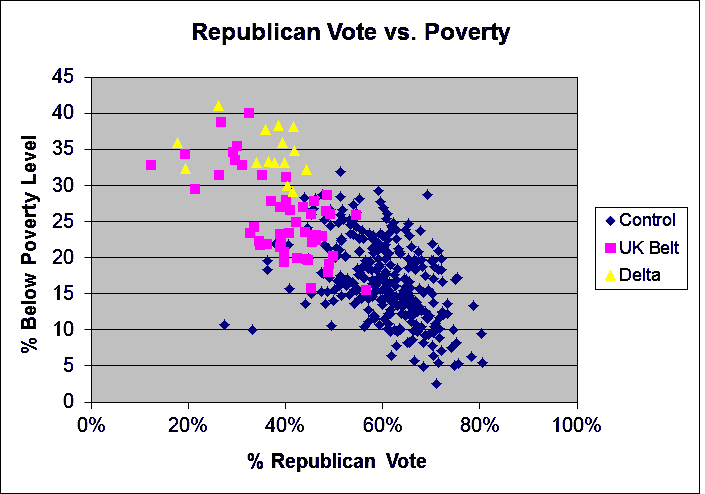
In the graphs below, three groups of counties are represented: UKBelt is the belt of counties along the Upper Cretaceous outcrop band, Delta is the Mississipi River Delta (actually, flood plain) counties and Control is all others.
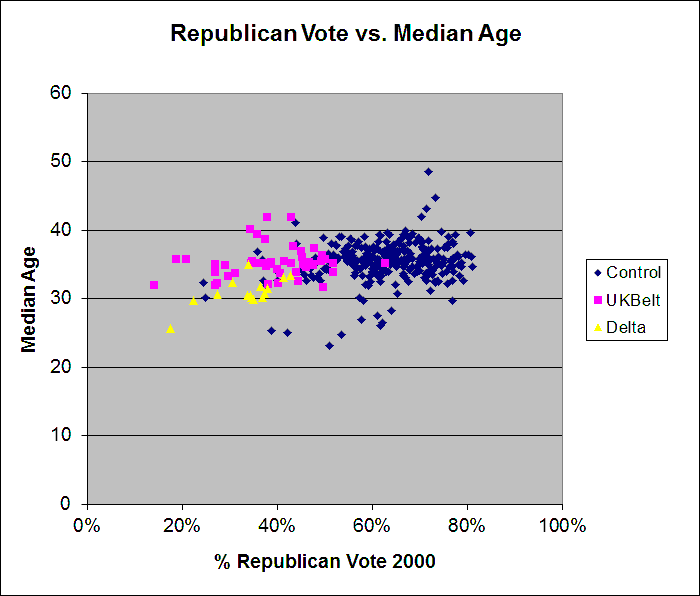
The UK Belt counties do not differ appreciably from Control counties in median age, although Delta counties are significantly younger.
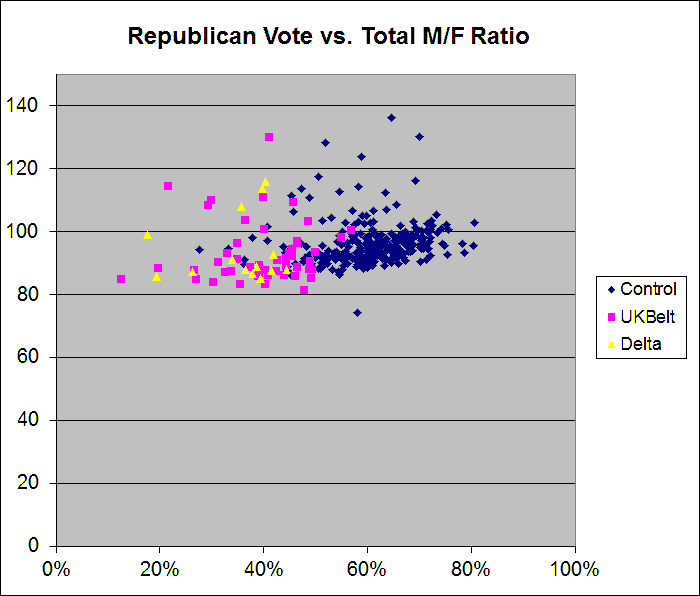
There's a slight upward trend reflecting the tendency of men to vote Republican more than women. The vertical axis is males per 100 females.
x
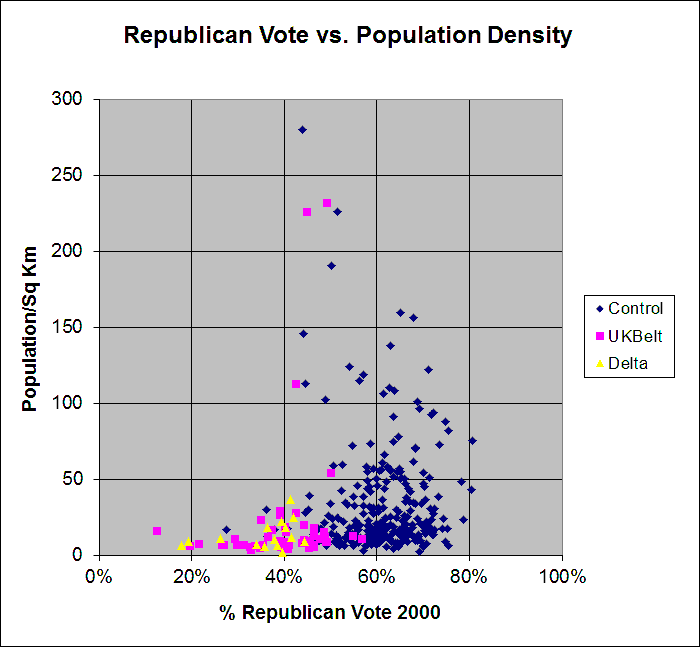
The Delta and UK Belt counties mostly have low population density.
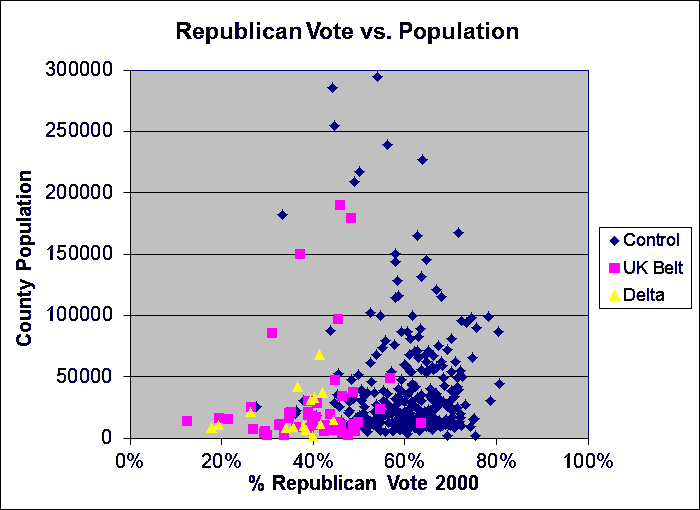
The Delta and UK Belt counties mostly have low population.
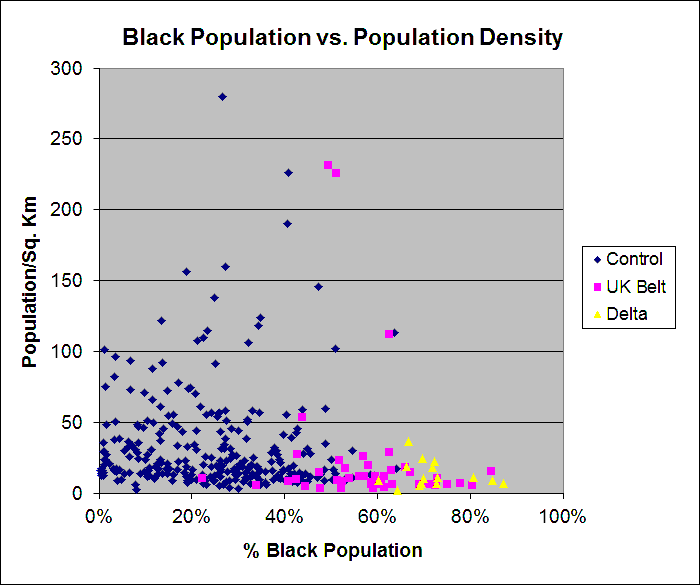
The UK Belt and Delta counties are more rural with low population density.
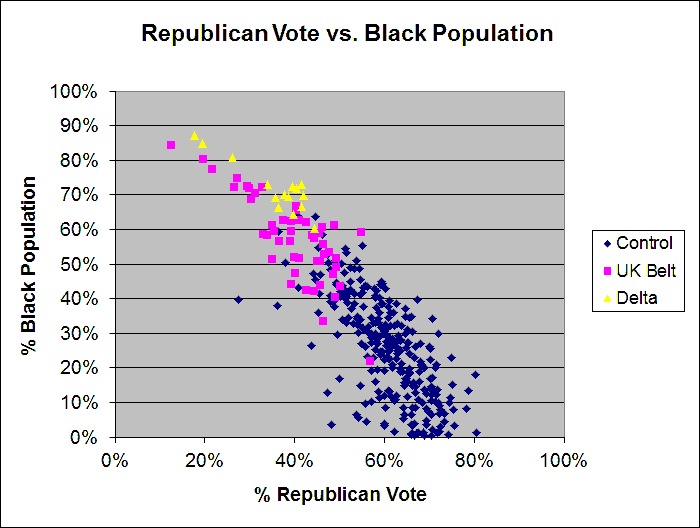
Blacks do not vote Republican. The correlation coefficient here is -0.91. You'd be happy to see a correlation coefficient like that in a physics experiment - you just plain don't see things like that in the social sciences. And this is county data for four states. If anything, the trend looks steeper in the Control counties. Does this suggest that whites vote anti-Democratic even more strongly than blacks vote anti-Republican?
x
Return to Overview
Geology and Election 2000: Election Returns
Geology and Election 2000: History
Geology and Election 2000: Economics and Land Use
Geology and Election 2000: Demographics
Geology and Election 2000: Demographics
Return to Professor Dutch's Home Page
Created 23 January 2002, Last Update 24 May 2020