U.S. Daily Temperature Extremes
Steven Dutch, Professor Emeritus, Natural and Applied Sciences, Universityof Wisconsin - Green Bay
General Comments
Although daily weather reports often mention the highest and lowest temperatures in the United States, there seems to be no comprehensive listing of daily extremes except for that on the USA Today web site, which lists records back to the founding of the paper in 1995. In September, 2006, I compiled these records into a spreadsheet for analysis, and obtained station coordinates from the Census Bureau listing of place names and a few other sources. Some place names could not be identified unambiguously, others were misspelled or misidentified by state and could be identified with varying degrees of confidence. Altogether I ended up with 14592 usable records. Of these, 3587 were low temperatures in Alaska and 655 were highs in Hawaii. For the conterminous U.S. I had 5505 high temperatures and 4845 lows. The disparity results from dates where multiple stations had the same readings.
An astonishing 97% of national highs occur in just four states: Florida, Texas, Arizona, and California. A single station, Death Valley, accounted for 1022 highs or almost 19% of the total, and the top ten stations accounted for half of all readings. After Florida, with 1005 records, the state with the next largest number of highs is Nevada, with 44. Altogether there were 313 localities represented.
Lows are more widely distributed. There were 412 localities, with 16 stations accounting for half the totals. Montana, with 834 records, has the largest number, but thirteen states have over 100 records apiece.
A number of localities have hosted both national high and low readings:
- Winnemucca, Nevada: High 100 on September 11, 2001. Low 20 on May 14, 1999.
- Hill City, Kansas. Highs: 102 on September 25, 1998 and 93 on April 17, 2004. Low: 3 on October 27, 1997
- Lamar, Colorado: High 107 on June 2, 2002. Low 17 on October 29, 1997. This station scored national highs and lows on its only two appearances.
- Tekamah, Nebraska: High 111 on July 12, 1995. Low –19 on January 17, 2003. This station also scored national highs and lows on its only two appearances.
- Fargo ND, 100 June 17, 1995; numerous lows. Lowest –31 January 27, 2004
- Grand Forks ND, 100 June 17, 1995; numerous lows. Lowest –37 January 28, 2004
- International Falls, Minnesota: High 99 on June 18, 1995. Numerous lows. Lowest –39 on December 12, 1995. Extremes only six months apart.
- Williston ND, 100 June 16, 1995; numerous lows.
Sports pundits are fond of saying that on any given Sunday, any professional football team can beat any other. Similarly, given sufficiently extreme conditions, any spot in the conterminous U.S. can host a nationwide high or low. Surely the extreme example is the hot spell in June, 1995 that caused notoriously cold localities in North Dakota and Minnesota to post nationwide highs. Even International Falls, Minnesota - International Falls, for Heaven's sake! - tied for a national high.
Alaska and Hawaii
Alaska and Hawaii are climatologically and geographically distinct from the conterminous U.S. and are not considered in detail here.
Alaska has recorded a national low on every calendar date.
Hawaii frequently has national highs in the winter, but had no national highs from May 7 to October 10. Hawaii's tropical latitude and maritime setting give it an advantage in the winter, but the stronger heating of the continental interior in the summer completely dominates the national pattern.
General Patterns
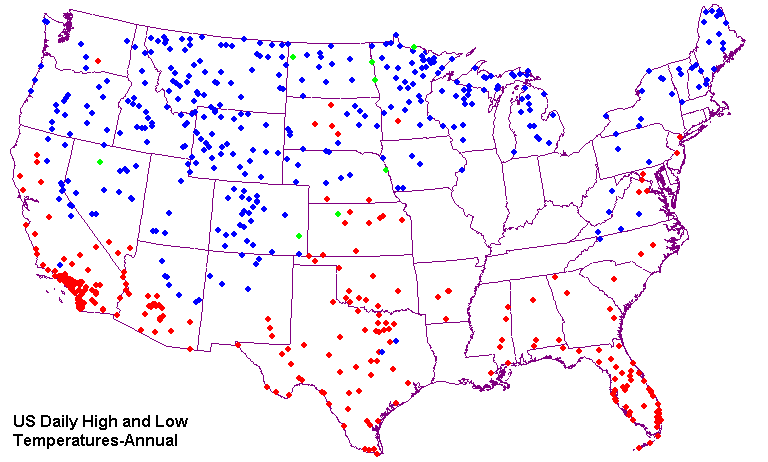
The map above shows high and low localities. Red denotes high, blue denotes low, and green denotes stations with both records. Note the large blank area centered on the Ohio Valley.
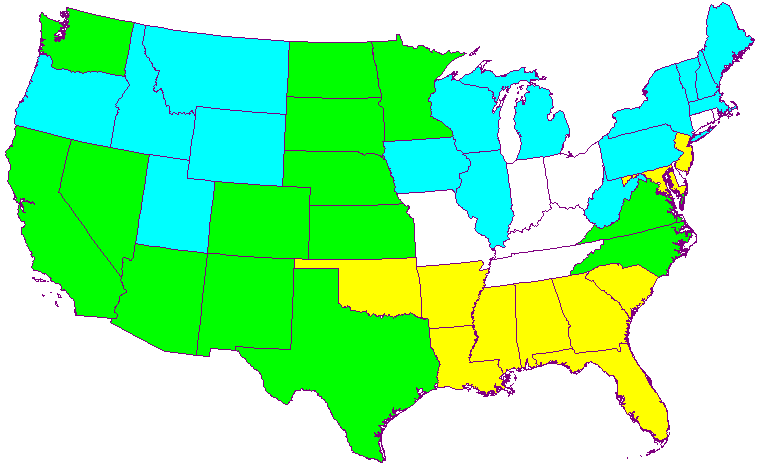
The map above shows states with records: yellow for highs, blues for lows, green for both. Note the absence of records in the Ohio Valley. Illinois posted only a single record and that was in the northwestern part of the state.
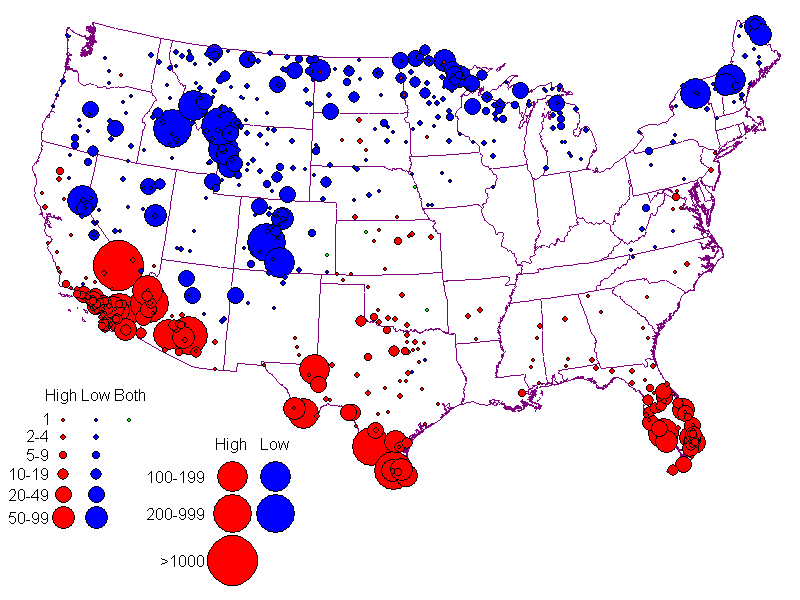
This map shows the frequency of records by station. Note the dominance of Florida, Texas, Arizona and California for highs. Lows are concentrated along the Canadian border and in the Rockies. Note the surprising number of lows in the Sierra Nevada. In the summer months it is fairly common for California to host the national high and low on the same day.
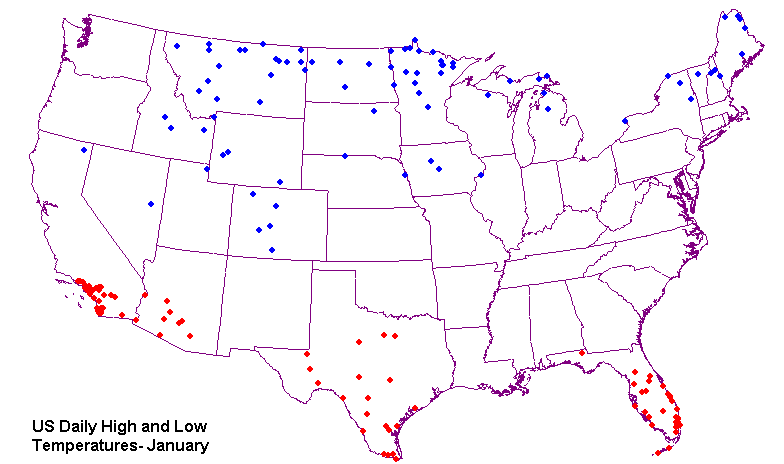
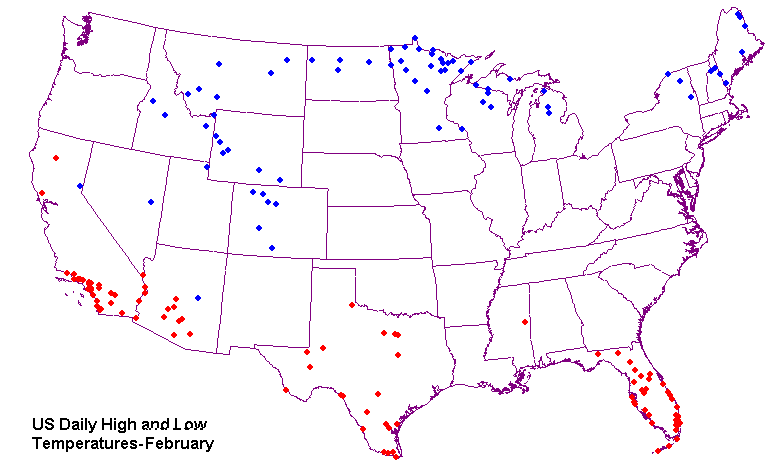
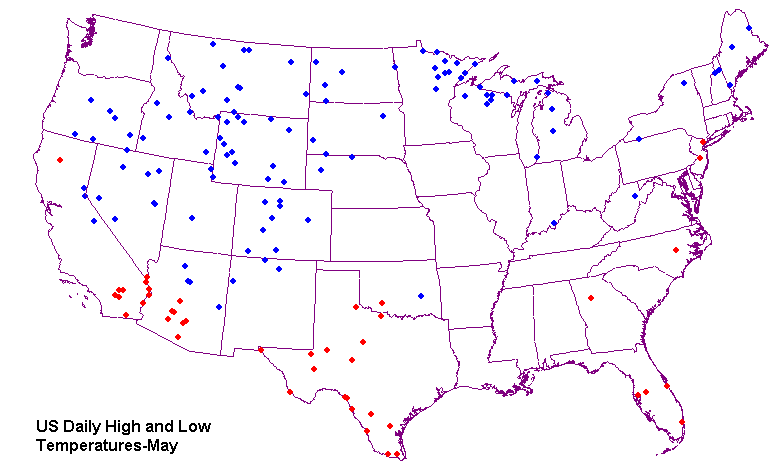
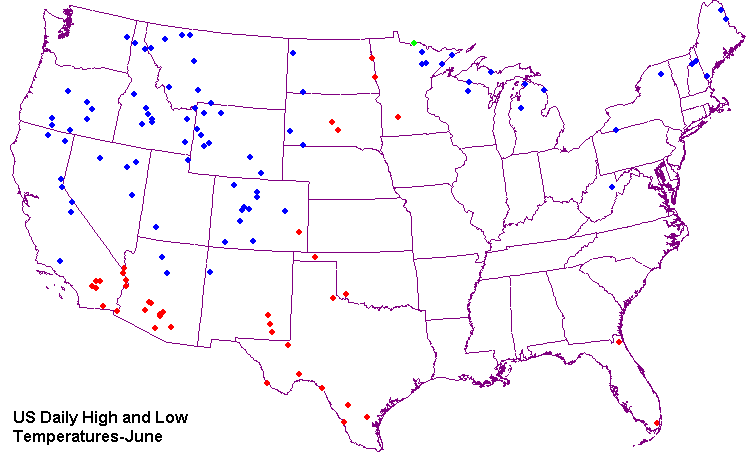
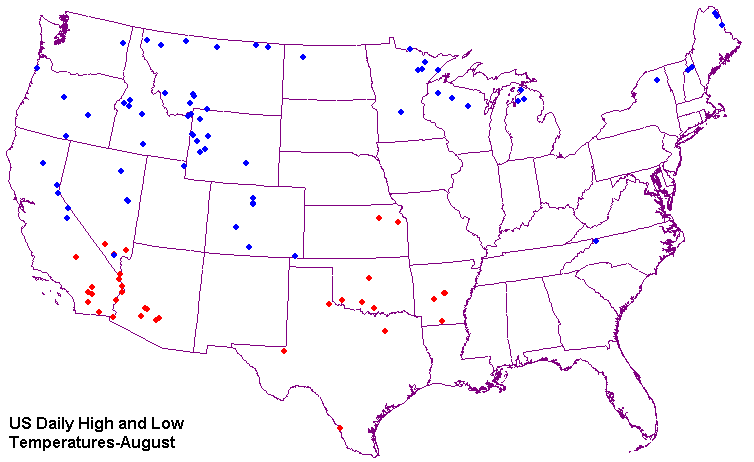
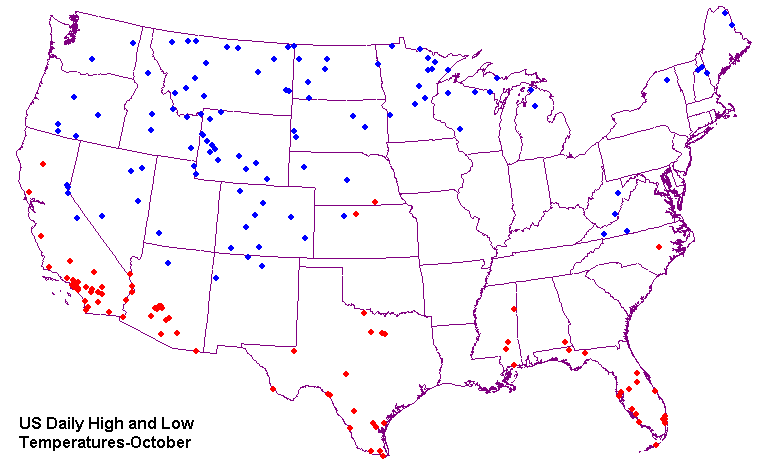
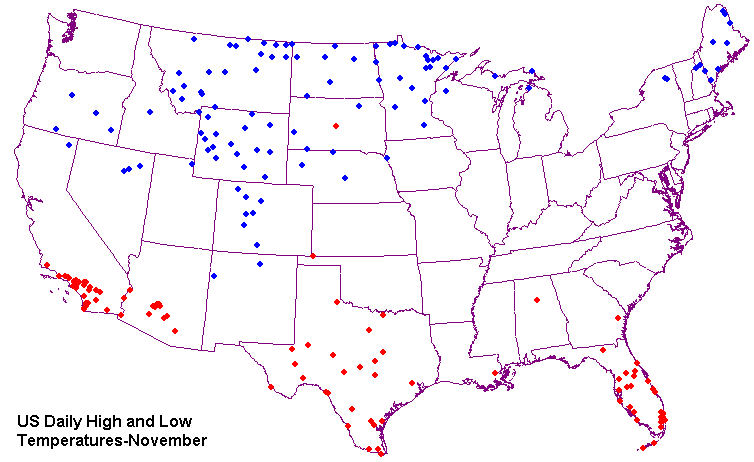
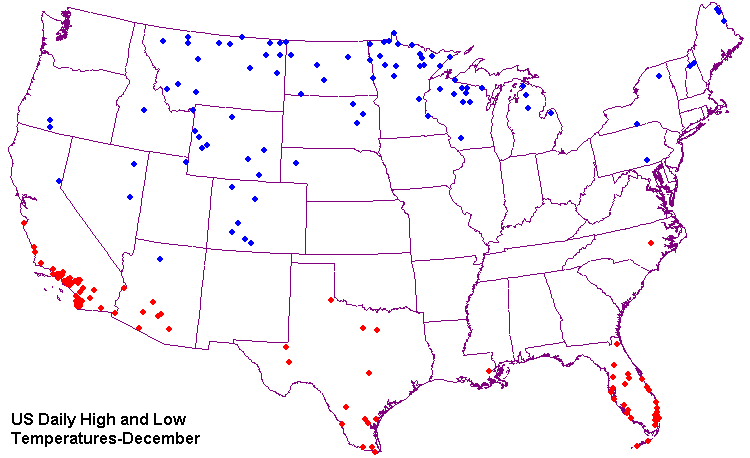
The maps below show highs and lows by month. January and February show the expected pattern of highs along the southern margin of the country and lows in the Canadian border states, the northern Plains and the Rockies.
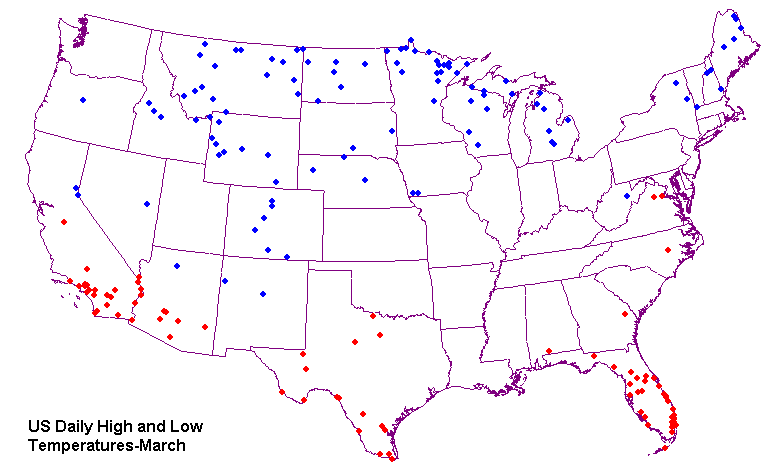
In March, highs begin to appear along the Atlantic coast.
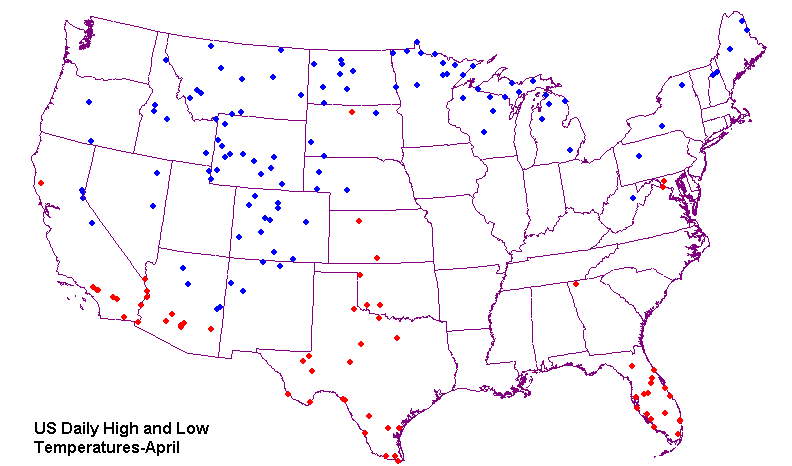
In April, highs begin to appear in the Plains states as well. Lows begin to creep southward in the mountain states.
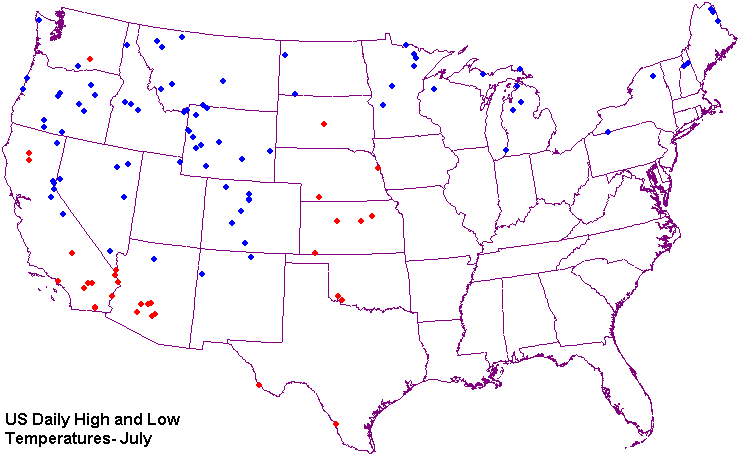
In June and July, highs can occur anywhere in the Plains states. Lows begin to become common in Oregon and Washington.Highs disappear entirely from Florida and become rare in Texas in the summer.
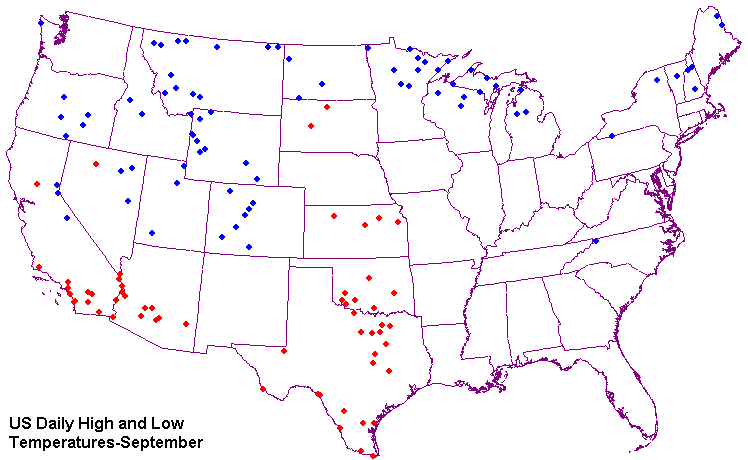
In September, the pattern begins to revert toward a more winter-like one. Highs retreat from the northern plains, lows from the southern Rockies and the Pacific Northwest.
Some General Observations
These are extremes, not averages. Since these are extremes, the occurrence of a record is a function of not only extreme conditions at a given location, but also conditions across the entire nation. A record high in Green Bay, Wisconsin might still be well below a fairly ordinary daily high in Needles, California, and a record low in Baton Rouge might be well below the daily high in Bismarck. Hawaii, Florida, and coastal southern California dominate nationwide highs in the winter when the continental interior is cold, but those regions do not get hot enough in the summer to equal the effects of heating the continental interior.
Some ferociously hot and cold places do not show up prominently because other stations act as "magnets" and dominate the records. Sacramento and Las Vegas can both be brutal in the summer but rarely post national highs because Death Valley is likely to be hotter. Vermont can get respectably cold in the winter but has few nationwide records because the Adirondacks to the west and the White Mountains to the east both get colder. Small states are less likely to host records simply by virtue of their size. Given a regional cold spell, probability dictates that the chance of having the national low is greater in Pennsylvania than in Delaware. Since the smallest states are also on the Atlantic coast and therefore more likely to be moderated by maritime effects, their likelihood of seeing a record is low.
U.S. Daily Highs
U.S. Daily Lows
Return to Professor Dutch's Home Page
Created 27 December 2006, Last Update 24 May 2020