Plotting Objects on the Opposite Side of the Sphere
Steven Dutch, Professor Emeritus, Natural and Applied Sciences,University of Wisconsin - Green BayThis page is designed to give an overview of the way mineralogy andstructural geology deal with the problem of points outside the primitive circle,or in other words, on the opposite side of the projection sphere. The descriptionsrefer to techniques that are explained in more detail on other pages.
Mineralogy
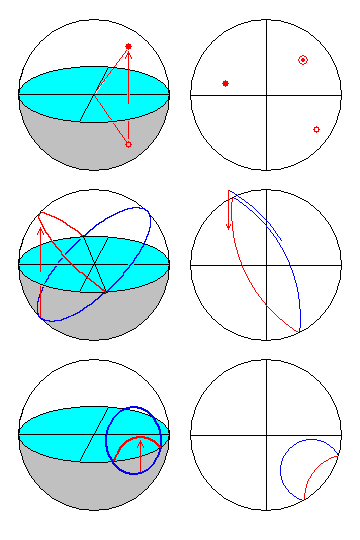
In mineralogy, data is plotted on the upper half of the projectionsphere. The lower half is the "opposite side" of the sphere. In mineralogy,we can't assume that a line that intersects the upper hemisphere also intersectsthe lower hemisphere. The reason is that lines are often used to representcrystal faces. These are poles to crystal faces, that is, linesperpendicular to the crystal face. It very often happens that a crystal willhave a face on one side but no corresponding face diametrically opposite. Thus,in mineralogy, it's essential to distinguish between lines that intersect thetop of the sphere and lines that intersect the bottom.
In a nutshell, objects on the lower half of the projection sphere arereflected through the equatorial plane to the upper hemisphere and then plotted.
 |
A line that intersects the bottom of the projection
sphere is simply reflected through the equatorial plane to the
upper hemisphere and then plotted. Typically, a solid dot is used for
upper-hemisphere points (lines), and an open circle for lower. If a
lower-hemisphere point plots at the same position as an upper-hemisphere
point (common because the equatorial plane is often a mirror symmetry
plane), both a dot and circle are plotted.
The lower-hemisphere of a great circle is similarly reflected. To measure an angle that crosses the primitive circle, count out along the upper-hemisphere circle (blue) and in on the lower hemisphere circle (red) as shown. A small circle that straddles the primitive circle is plotted as shown. The upper-hemisphere portion is plotted (blue) as well as the reflected lower hemisphere portion (red). |
Structural Geology
In structural geology, data is plotted on the lower half of thesphere. We simply imagine we are looking into a sphere half-submerged in theearth. It is rarely necessary to imagine that lines or planes extend in onedirection only. Therefore, in structural geology, we simply plot whicheverend of the line or plane that intersects the lower hemisphere. In those rarecases where we have to deal with upward-pointing structures (attitudes measuredby aiming up at an overhanging outcrop, current directions or slickensides thatpoint up, etc.) we can usually plot the lower end of the structure and denote itwith a special symbol.
The one situation in structural geology that does require moving betweenhemispheres is rotation of data, a fairly advanced and rare application.
 |
Usually lines can be plotted by plotting their lower-hemisphere
ends. Special symbols can be used to keep track of cases where lines
are unidirectional (current directions, etc.)
It is almost never necessary to distinguish between the upper and lower portions of a plane. Angles can always be measured by counting off within the primitive circle. If for some reason you need to measure an angle that straddles the primitive circle, count out to the primitive circle (blue) and then continue in from the opposite end (red). Imagine sweeping the angle out with a line. As one end of the line moves into the upper hemisphere, the other end enters the lower hemisphere on the opposite side. Small circles represent lines on the surface of a cone, but the lines continue through the center and sweep out a matching small circle on the other side. Plot the lower-hemisphere portions of both circles. |
A Possibly Interesting Piece of Stereo-Trivia
 |
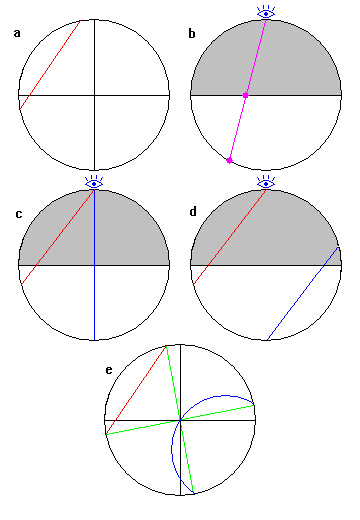
a. A straight line passing through the center
of a stereonet obviously represents a vertical great circle. What does
a straight line not passing through the center represent?
b. Recall that the projection point for the stereographic projection is on the sphere, and points are projected onto the equatorial plane. c. To project as a line, the points must be in a plane passing through the projection point. Great circles (blue) are planes that pass through the center of the sphere. But other planes (red) are possible. They cut the sphere in small circles. d. A small circle represents a cone, whose other side also cuts the sphere (blue). Note that, if one side of the cone passes through the projection point, the other side passes through the diametrically opposite point. e. The complete cone plotted. Whenever a small circle (blue) passes through the center of the stereonet and cuts the primitive circle, the other side of the small circle plots as a straight line (red). |
Access Crustal Movements Notes Index
Return to Techniques Manual Index
Return to Professor Dutch's Home Page
Created
24 August 2000, Last Update 24 August 2000