Seismic Refraction - Ray Paths
Steven Dutch, Professor Emeritus, Natural and Applied Sciences,University
of Wisconsin - Green Bay
Seismic reflection is a lot like radar or sonar in principle. It's easy to visualize and pretty easy to look at data and interpret structure. But it's quite expensive. Seismic refraction isn't as easy to visualize, and it's impossible to look at the data and easily picture the structure. But it can cover a lot more ground than seismic reflection. It's very well suited to places where layers are nearly horizontal, like small scale subsurface survays or the ocean floors, but it's very hard to apply to complex structures.
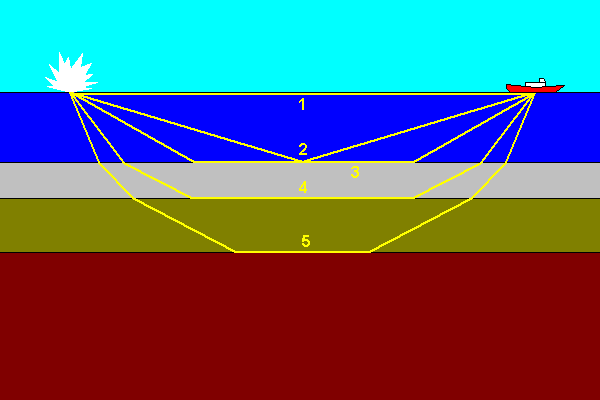
A typical seismic refraction scenario looks like this. Between the shot point and the ship is a cable with sensors. The normal state of affairs is for sound velocities to increase with depth, so that rays get refracted toward the horizontal as they go deeper. How will the travel time from the shot point look at different distances?
A graph of signals received versus time looks like this:
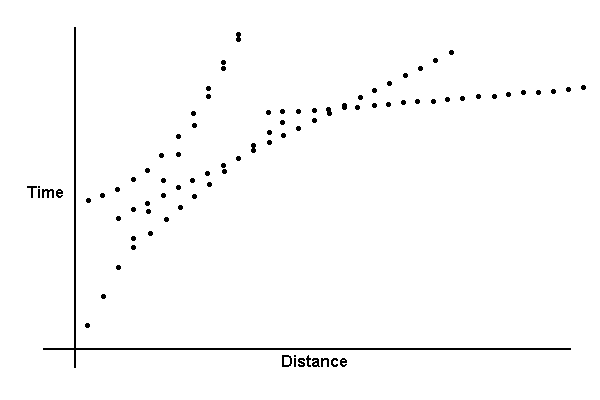
The signals fall into several groups, corresponding to the different signal paths shown above.
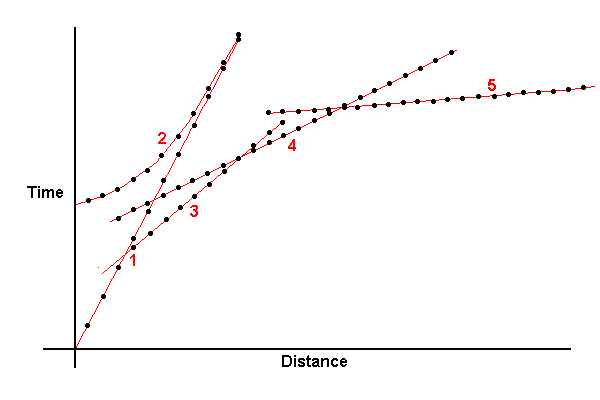
- These are direct signals through the water from the shot point to the receiver
- These are reflected off the bottom. They are never first arrivals but asymptotically approach the direct arrival times as distance increases.
- These went down to the bottom and traveled along the top of the first sub-bottom layer. Since the velocity in this layer is faster than the velocity in water, eventually these signals get to the receivers first
- These went to the boundary of the second sub-bottom layer, traveled faster in the second layer, and eventually overtake the signals that traveled more direct, but slower routes.
- These went down to the boundary of the third layer.
The slope of each segment of the graph = time/distance = 1/velocity. So the slopes give us a very important piece of information: the velocity within each layer. (But only if the layers are horizontal).
Treating the signals as rays is useful in a number of respects. For example, we can use Snell's Law to interpret the graph and determine the thickness of each layer.
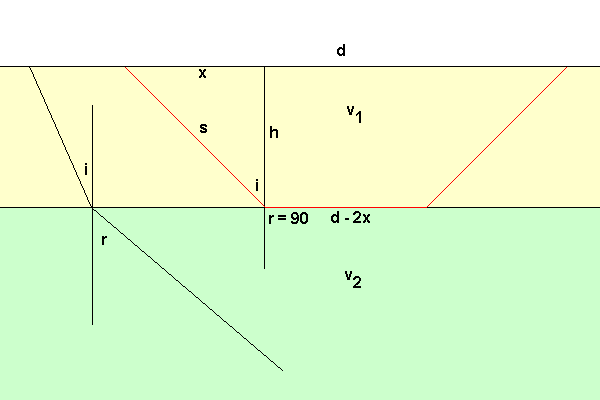
Snell's Law for refraction is sin r/sin i = v2/v1. We know the velocities
from the slopes of the line segments on the travel time graph. When r = 90,
we have sin i = v1/v2. It's impossible to have refraction into the lower layer
for larger i - instead we get total reflection off the bottom. We want to find
the value d where the signal along the boundary is faster than the direct signal.
Direct travel time is d/v1. The refracted travel time is time down the slanting
red path (s), along the layer boundary and up the other slanting path. The slant
distance is s, so the travel time is s/v1. The travel time along the boundary
is (d - 2x)/v2. Since
x = s cos i, travel time along the boundary is (d
- 2s sin i)/v2. Total travel time is thus
T = 2s/v1 + (d - 2s sin i)/v2.
We want to find where T = 2s/v1 + (d - 2s sin i)/v2 =< d/v1
Clearing fractions by multiplying both terms by v1 v2, we get
2s v2 + (d - 2s sin i) v1 =< d v2
Solving for d (called the crossover distance), we get
2s (v2 - v1 sin i) =< d(v2 -v1)
Also, from Snell's Law, Sin i/Sin 90 = v1/v2, so 2s (v2
- v12/v2) = 2s (v22 - v12)/v2 < d(v2
-v1)
What we really want is h. h = s cos i, and s = h/cos i. Since sin i
= v1/v2, cos i = √(1 - (v1/v2)2). Clearing fractions, cos i = (√(v22
- v12))/v2, and s = h v2/(√(v22 - v12)). Combining
terms, we get
2s (v2 - v1 sin i) = 2h v2/(√(v22 - v12)) (v22 - v12)/v2 =< d(v2 -v1)
2h v2/(√(v22 - v12)) (v22 - v12)/v2 = 2h √(v22 - v12) =< d(v2 -v1)
and h =< (d/2) √((v2-v1)/(v2+v1))
The two path travel times are equal where the travel time line segments for the first two layers cross. Additional layers can be treated by calculating where the ray will travel along the bottom of the next layer, using data from previous layer solutions.
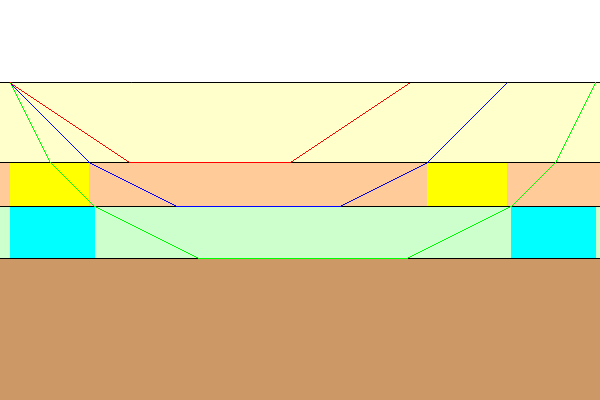
In the case above, we can solve for the thickness of the first layer (red). We can then use the thickness and velocity information to determine the lengths of the yellow intervals in the second layer. We can solve the remaining path (blue) using the same method as for the first layer. We now have the information we need to calculate the light blue intervals in layer 3 and can solve for that path (green).
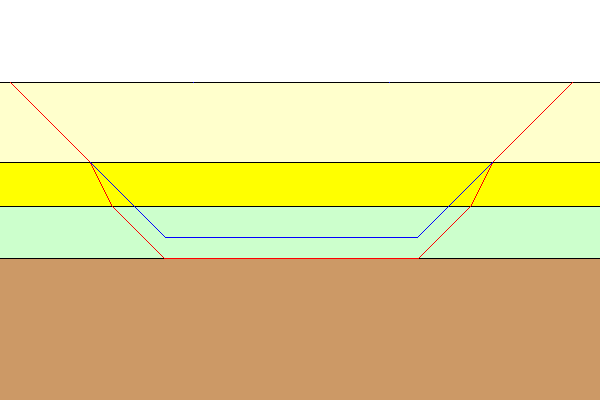
In those uncommon cases where there's a velocity inversion, where a layer has slower wave velocities than the layer above it, it is impossible to detect the layer, because the signals are refracted downward. Instead, the thickness of the layer below will be calculated as some combination of the two layers (as if the signal had traveled the blue path).
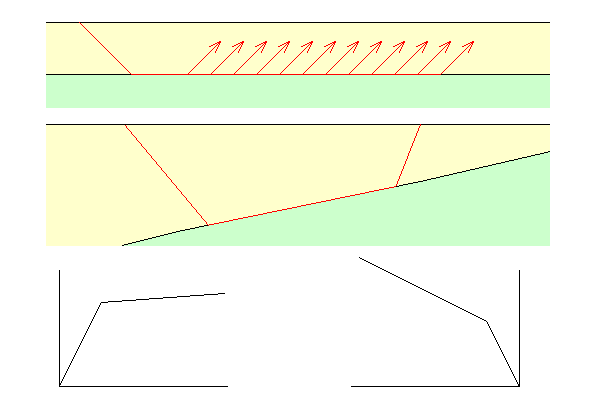
Although treating the seismic signals as rays leads to useful results in solving for simple cases, it creates mysteries as well. At top, how does a signal along the boundary "know" where to come up to arrive at a receiver? And if the signal is constantly leaking energy, where does the energy come from? If the boundary has zero thickness, doesn't that imply infinite energy density?
When layers are tilted (middle), the formulas get much more complicated. The solution for tilted layers involves running profiles in opposite directions. The resulting travel time curves have different crossover times and different slopes for the lower layer (bottom). It's not immediately obvious why that should be so, but it gets worse. In extreme cases, one of the graphs can have a flat second segment. Signals get to different distances simultaneously, as if the wave is infinitely fast! And for steeper dips, the second leg of one graph can even have a negative slope.
Fortunately, there's another way to visualise seismic reflection that is far more intuitive.
Return to Course Syllabus
Return to Techniques Manual Index
Return to Professor Dutch's Home Page
Created
19 December 2000, Last Update
12 June 2020