Contouring Structural Data: Overlapping Circle Method
Steven Dutch, Professor Emeritus, Natural and Applied Sciences, University of Wisconsin - Green Bay
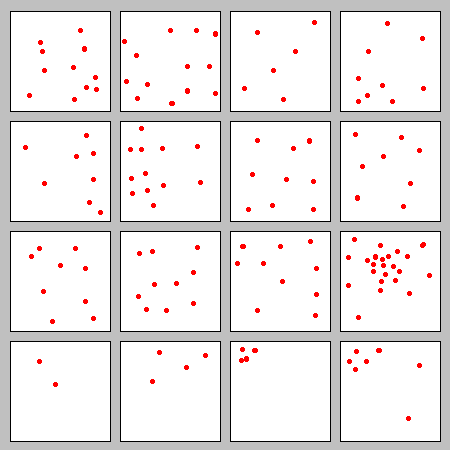 |
The red dots show the locations of people in a village. How can we characterize the population density from place to place?
Strictly speaking, the population density is very high where a person is and zero everywhere else. But we define density in terms of some area that gives useful information, say, per one percent of the town's area. |
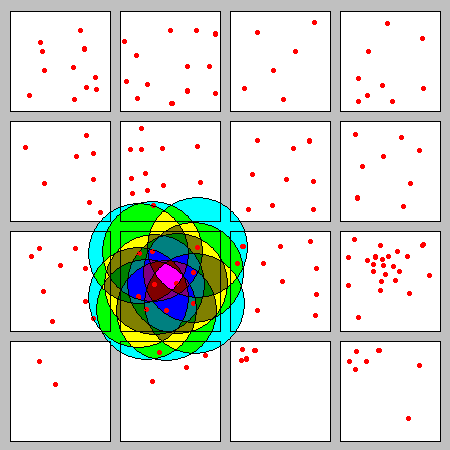 |
One way to do it is to center a circle on every person. If the circle has unit area, then everywhere within a circle centered on a person, we have one person per unit area. Where two circles overlap, there are two people per unit area in the overlap area.
In the example here, for one block, density is highest in the center of the block where we are a short distance from a lot of people. |
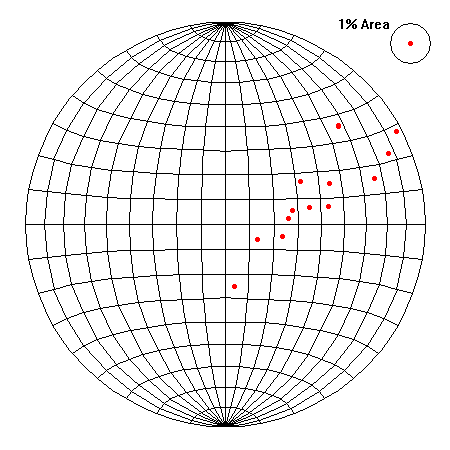 |
When contouring structural data, we must use the equal area net. If we used a stereonet, a circle of a given size would cover less angular area near the primitive circle than it would in the center of the net.
We customarily contour in terms of points per one percent area of the net. One percent conveniently translates into a circle with one tenth the diameter of the net. Some purists have been concerned about the effects of linear distortion near the primitive circle and have gone so far as to create ellipse templates to use for contouring different areas of the net. In practice, there does not seem to be any significant improvement from going that extra step. |
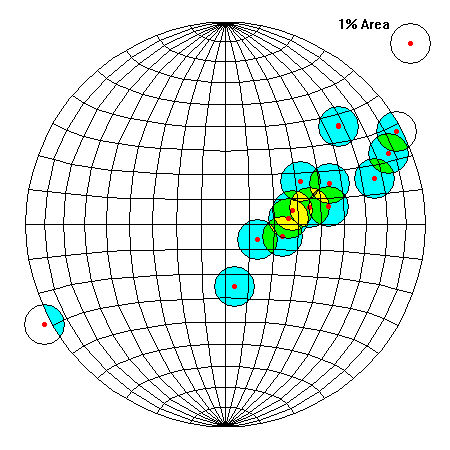 |
We center a circle on each point and color code the densities. Circles that extend beyond the primitive circle must re-enter on the opposite side of the net (as around azimuths 060 and 240).
A simple rule can be used for coloring. Every time you cross a circle, the density increases by one. Start with the lowest densities and work inward. |
Advantages
- Completely impartial. Barring errors, everyone who uses this method gets the same result.
- Best when data are comparatively sparse
Disadvantages
- Can be hard to do accurately when data densities are very high
- When data are sparse, can create a misleading impression of precision.
Computer Contouring
The easiest way to contour data by computer is a variation on this method. Create a data array corresponding to a grid of points covering the net. For each grid point, determine how many data points lie within a certain angular distance and put that value in the array, then print out or display the result.
Return to Course Syllabus
Return to Techniques Manual Index
Return to Professor Dutch's Home Page
Created 16 June 2005, Last Update
12 June 2020