Construct Simple (Schematic) Cross-Section from Map Data
Steven Dutch, Professor Emeritus, Natural and Applied Sciences, University of WisconsinGreen Bay
Firsttime Visitors: Please visit Site Map and Disclaimer. Use "Back" to return here.
This problem brings together all of structural geology. There is no recipe for solving all problems of this class; only some general principles.
- You can't draw a cross-section of a structure if you don't know it exists. For example, if you picture all folds as upright and symmetrical, you will not be able to draw an accurate cross-section of asymmetrical folds. You can't draw a cross-section of a salt dome if you don't know what it looks like. Experienced geologists draw better cross-sections than novices.
- Try to get into the habit of thinking three-dimensionally. When you look at a unit on the map, try to picture the units beneath it and the units that once lay above it before erosion.
A Few Rules
- If you have strike and dip data, you must calculate the apparent dips of layers in your cross-section. You can't blindly use actual dips if your section is inclined to the strike.
- Do not exaggerate the vertical scale unless you have very good reason to. Later on we will cover the construction of exaggerated cross-sections.
- Do not be surprised if the topographic relief turns out to be insignificant on the cross-section. If your cross-section is more than a few kilometers long, the relief will almost certainly be insignificant.
- Beware of extrapolating structural data from points far away from your section line.
- Remember that there were rocks once above the present level of erosion. Don't hesitate to show structures above the present land surface if doing so will help make structures clearer. For example, it is perfectly permissible to connect beds on opposite sides of an anticline and show their configuration before erosion.
Example
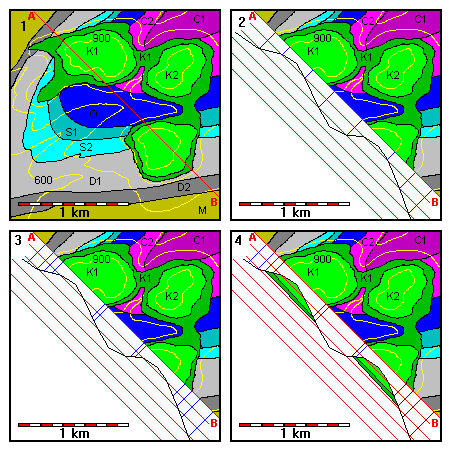
In the diagram below, standard USGS symbols for periods are used: C for Cambrian, O for Ordovician, S for Silurian, D for Devoniam, M for Mississippian, K for Cretaceous. Topographic contours are yellow. For clarity, only the 600 and 900-meter contours are labeled.
 |
1. The problem: construct a cross-section along line AB (red).
2. Project or transfer topographic data to a cross-section diagram. Include points where topographic contours cross the section line as well as any other major topographic data, such as hilltop elevations, valley bottoms, and so on. 3. Project geologic contacts to the cross-section. 4. We can draw the base of the Cretaceous rocks on the cross-section as a flat plane. |
We note that the Cretaceous rocks have the outcrop patterns we associate with flat-lying rocks. They occur on the hilltops and their contacts are at a constant elevation on the map and in the cross-section. There could be irregularities on the contact, but we have no data to indicate them.
 |
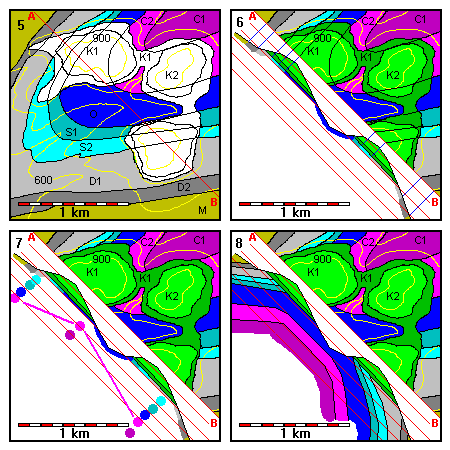
5-6. Since we now understand that the Cretaceous rocks are just a covering veneer on the rocks below, we can project geologic data beneath them, and thence to the cross-section, getting at least some idea where the buried contacts run.
7. The older rocks (C- M) are obviously folded, but how? The answer: think superposition. If we drilled down into the Mississippian rocks, we would pass through progressively older rocks. The fold with Cambrian in its core must be an anticline. 8. With the essentials of the structure figured out, complete the cross-section. |
If we had dip data, we could transfer it to the map. This example has none to show you that it is still possible to produce a well informed cross-section just from outcrop patterns. In this case, we see that the outcrop bands on the south side of the fold are systematically wider than on the northeast side, indicating shallower dips on the south sides.
Without actual dip data, the cross-section will be schematic rather than strictly quantitative, but it will still greatly aid in visualizing the structure. Even if you have dip data, it may be a good idea to do a schematic section first to get a grasp of the structure.
Pitfalls of Dip Data
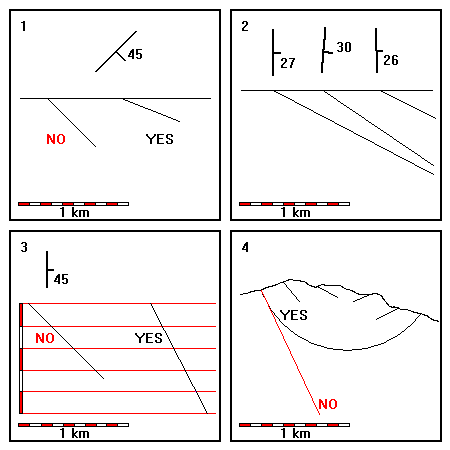
Dip data is sometimes more misleading than helpful. Beginners tend to draw long lines extending down the dip, then construct the structure from there. On the scale of a typical map or cross-section, a dip measurement cannot be extrapolated more than a hair's breadth beneath the surface. The only requirement is that the structure be tangent to the dip measurement. A hundred meters below the surface the dip might be quite different.
 |
1. If the strike is oblique to the cross-section, you must use apparent dip rather than real dip.
2. If attitude data are somewhat variable, use an average value rather than taking each measurement literally. Tiny errors in dip measurement will cause layers to appear to pinch out or swell, even if the layers are actually uniform in thickness. 3. If you draw exaggerated cross-sections, you must exaggerate the dip as well. 4. Avoid extrapolating surface data to excessive depths. |
Useful Formulas to Note
Apparent Dip:
Tan (Apparent Dip) = Tan (True Dip) Sin (Angle between strike and cross-section).
In the example (1) above, the true dip = 45 degrees and the angle between the strike and cross-section also equals 45 degrees, so we have Tan (Apparent Dip) = Tan (45) Sin (45) = 0.707, and Apparent dip = 35.2 degrees.
Exaggerated Dip:
Tan (Exaggerated Dip) = (Exaggeration Factor) Tan(Apparent Dip)
In the example (3) above, the apparent dip (= true dip) = 45 degrees, and the exaggeration factor = 2. So we have Tan (Exaggerated Dip) = 2 Tan(45) = 2 and Exaggerated Dip = 63.4 degrees
Return to Course Syllabus
Return to Techniques Manual Index
Return to Professor Dutch's Home Page
Created 24 August 2000, Last Update