Plot a Line on a Stereonet Given its Trend and Plunge
Steven Dutch, Professor Emeritus, Natural and Applied Sciences, University of Wisconsin - Green Bay
Example
Plot a line trending 222 degrees and plunging 37 degrees.
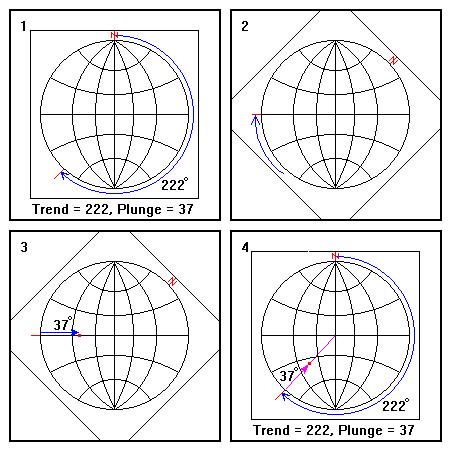 |
1. Count off the trend around the circumference of the stereonet and mark it. 2. Rotate the overlay so the trend lies along one of the vertical great circles. It does not matter which one. 3. Count in along the great circle and plot the point at the appropriate plunge. 4. Rotate the overlay to its original position. |
In most constructions involving plotting lines, it does not matter whether you use the equator or the north-south prime meridian to measure plunge. Both circles are the same (can you see why?) But it does matter in plotting planes because most of the time we either want to draw a great circle or measure a plotted one. In either case we have to line up the overlay so that we can either plot the great circle or line a plotted circle up along one of the circles on the net.
Return to Course Syllabus
Return to Techniques Manual Index
Return to Professor Dutch's Home Page
Created 5 January 1999, Last Update 16 March 1999