Weathering, Soils and Groundwater
Steven Dutch, Professor Emeritus, Natural and Applied Sciences, University of Wisconsin - Green Bay
The Rock Cycle

The Ideal Rock Cycle
- Igneous rocks form when molten rock (magma) invades the crust.
- They break down by weathering and the breakdown products are transported by erosion.
- The breakdown products are deposited to form sedimentary rocks
- Sedimentary rocks are buried, subjected to heat, pressure, and the action of fluids
- Heat, pressure, and the action of fluids change rocks, forming metamorphic rocks.
- Metamorphic rocks may eventually be heated enough to melt, forming a new generation of igneous rocks.
Anything can happen in the Rock Cycle
- Igneous rocks can be subjected to heat, pressure, and the action of fluids to form metamorphic rocks.
- Igneous rocks can be re-melted, forming a new generation of igneous rocks.
- Sedimentary rocks can be weathered and eroded to form a new generation of sedimentary rocks.
- Sedimentary rocks may eventually be heated enough to melt, forming a new generation of igneous rocks (although technically they'd be metamorphic by the time they melted).
- Metamorphic rocks can be weathered and eroded to form sedimentary rocks.
- Metamorphic rocks can be subjected to heat, pressure, and the action of fluids to form a new generation of metamorphic rocks.
Weathering
Breakdown of Rock near the Surface Due to Surface Processes
- Chemical Alteration (Often Addition of Water)
- Solution & Leaching
- Biological Action
- Hydration
- Mechanical
- Impact
- Frost - Wedging
- Plant Roots
- Salt Crystal Growth
- Expansion of Hydrated Minerals
Mass-Wasting
Movement of Large Amounts of Material Downhill under Gravity
- Creep
- Mudflows
- Slump
- Rockfalls
- Avalanches
Surface Area and Weathering
Imagine a cube of rock one meter on a side:
 |
Thus: -- Divide the edges by 2, total area increases 2 times -- Divide the edges by 3, total area increases 3 times -- Divide the edges by n, total area increases n times For a one-meter block crushed into 0.1 mm pieces, the edge length is divided by 10,000, and the area multiplied by 10,000. 10,000 square meters is over 100,000 square feet or 2-1/2 acres. |
Surface-Volume Effects
The smaller we subdivide particles, the more surface area is exposed. Things that happen at surfaces, like heat transfer or chemical reactions, happen faster. Some common applications of this fact:
- Crushed ice cools faster than an ice cube
- Granulated sugar dissolves faster than a large lump
- A carburetor or fuel injector sprays a fine mist of gasoline into an engine cylinder
A more serious example:
Flour in a sack in your kitchen is about as inert as a material can get. Grain dust (which is what flour is) dispersed in the air is highly combustible, even explosive. Every year a couple of dozen people in the U.S. die in grain elevator explosions caused by suspended dust. Coal dust in mines can be even deadlier.
How Surface-Volume Ratio Affects Weathering
 |
Hence: corners of blocks weather fastest, then edges, then faces. The interior is immune as long as the surrounding material is intact. |
What Determines Soil Type
- Climate
- Vegetation
- Drainage
- Time
- Parent Material
- Residual - Transported
- Least Important Factor for Mature Soils
Soil Formation
Young Soils
Strongest Influence Is Parent Material
Mature Soils
Strongest Influences:Climate, Vegetation, Drainage
Processes
Leaching from Surface
- K, Mg, Na
- Ca
- Si
- Al, Fe
Accumulation beneath Surface
- Al, Fe in Humid Climates
- Ca in Arid Climates
Soil Horizons and Profiles
Soil Horizons
Layers in Soil
Not Deposited, but Zones of Chemical Action
Soil Profile
Suite of Layers at a Given Locality
Limits of Soil Formation
- Balance Between:
- Downward Lowering of Surface
- Downward Migration of Horizons
- If erosion rapid or soil evolution slow, soils may never mature beyond a cetrain point.
- Extremely ancient soils may have lost everything movable
Soil Classification
This may be the most difficult classification problem in science because of the many factors involved.
Multiple Objectives
Scientific
Genesis & Evolution
Agricultural
- Fertility
- Most Effective Use
Engineering
- Slope Stability
- Expansion and Shrinkage
- Stability of Excavations
Varied Bases for Classification
- Parent Material
- Constituent Material
- Maturity
- Structure
- Climate & Vegetation
"The 7th Approximation"
- US Soil Conservation Service
- 12 Soil Orders
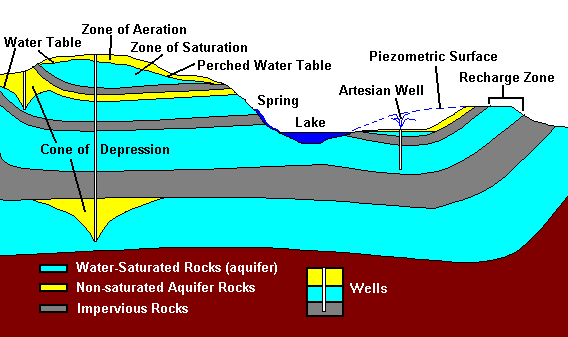
Groundwater
The Hydrologic Cycle

Aquifers
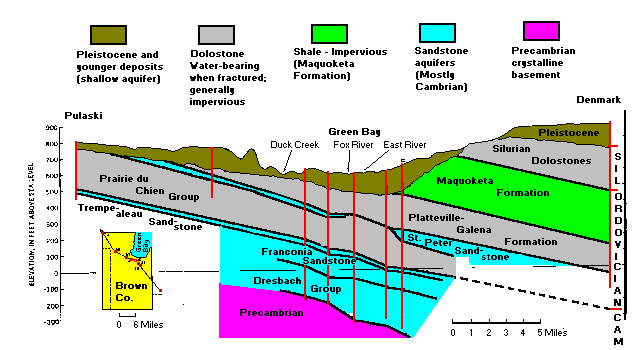
Green Bay Case Study
Deep Aquifers of the Green Bay Area
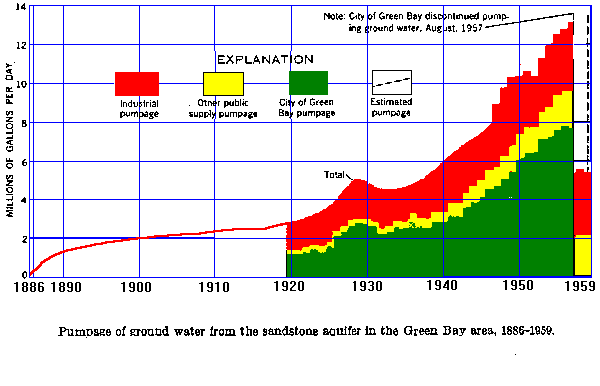
Green Bay Groundwater Pumping 1880-1960
Green Bay Water Table 1880-1960
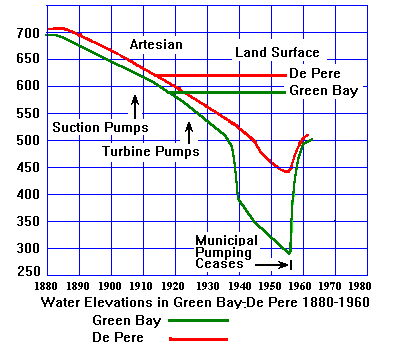 |
The recharge zone for the deep Cambrian sandstone aquifers is near the Wolf River, at an elevation more than 50 m above Green Bay. Thus, the deep aquifers were originally artesian, and the piezometric surface was up to 25 m above ground level. By about 1910, the groundwater had been depleted so much that the piezometric surface was near ground level and suction pumps had to be installed. Suction pumps will lift water only about 10 m, the height of a water column that equals atmospheric pressure. |
By the 1920's the piezometric surface had fallen an additional 10 m and turbine pumps had to be installed. The piezometric surface continued to plummet until 1957, when Green Bay ceased municipal pumping and began drawing water from Lake Michigan. The piezometric surface recovered rapidly.
Green Bay Piezometric Surface
 |
 |
| The piezometric surface just as pumping ceased. A classic cone of depression. | The piezometric surface a couple of years after pumping ceased. Note the dramatic but not complete recovery, since there is still a good deal of private pumping and municipal pumping outside Green Bay. |

A comparison of water use and piezometric surface 1920-1960. Note that when the city of Green Bay stopped pumping, water use dropped to levels of about 20 years earlier, and the piezometric surface rose to levels of about 20 years earlier.
The Russian Radioactive Waste Injection Program
Graphics based on illustrations in The New York Times.

The waste is injected into porous sandstones beneath impervious clay layers. The geology seems pretty well suited to this sort of system but the waste is spreading faster than expected. It is entirely possible the waste will never escape, or escape after such a long time that most of the radioactivity has died away. However, if it does escape, the results could be bad.
Mass Wasting
Viaont, Italy, October 9, 1963
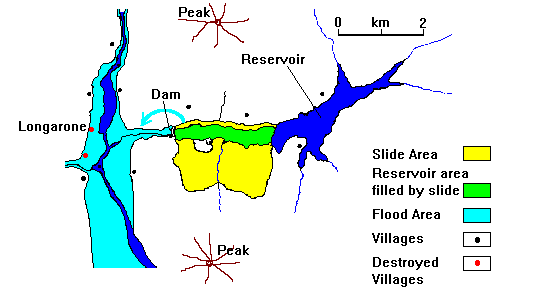 |
| The nearly 300-meter tall Vaiont Dam was the tallest in Europe when it was completed. In the fall of 1963 heavy rains weakened a shale layer south of the reservoir. On October 9 the shale gave way and the overlying layers slid downhill into the reservoir. The dam, amazingly, was undamaged. Instead, water from the reservoir was simply pushed up the opposite valley wall and around the dam. The first casualties were some dam workers staying in a hotel 300 meters above the dam. The water then poured down-valley, wiping out the village of Longarone and several smaller villages. 1800 people died. |
Yungay, Peru, May 31, 1970
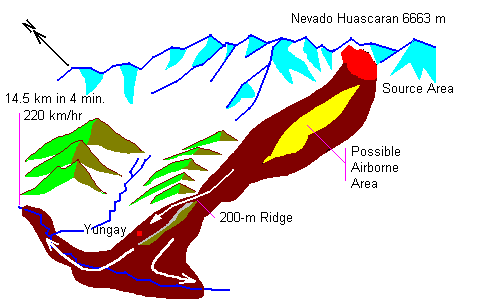 |
A magnitude 8 earthquake triggered a huge avalanche from the summit of Nevado Huascaran, the highest peak in Peru. Part of the landslide jumped a 200-meter ridge, wiping out the town of Yungay and killing all but about 100 of its 20,000 inhabitants. This is the worst avalanche disaster in history.
In addition, the earthquake killed another 50,000 people elsewhere in Peru. The total death toll of about 70,000 makes this the worst natural disaster ever in the Southern Hemisphere. |
Sherman Glacier, Alaska, March 27, 1964
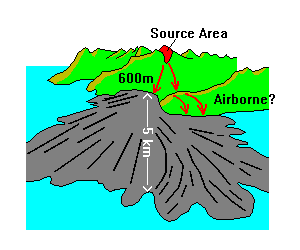 |
The great Good Friday earthquake of 1964 triggered a large rock avalanche that fell 600 meters (2000 feet) and then spread 5 km (3 miles) across the Sherman Glacier, resulting in a blanket 3-6 meters (10-20 feet) thick. The avalanche is dramatically visible because it contrasts with the white glacial ice. The drawing at left is based on a photograph. The flow ridges and lobes are characteristic of large avalanches. |
Lituya Bay, Alaska, July 9, 1958
A magnitude 7 earthquake on the Fairweather Fault (Southeast Alaska's equivalent of the San Andreas) triggered a landslide that dropped into a glacial bay (fiord). The resulting wave washed away the forest on the opposing side to a height of 1720 feet, the highest known wave ever documented.
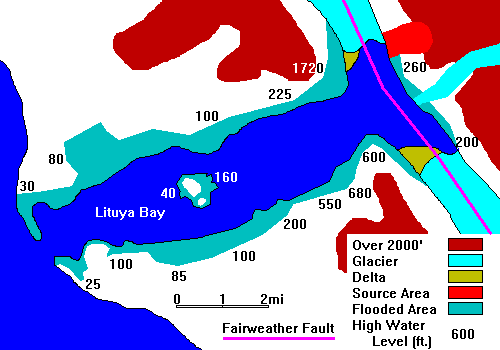 |
Note from the sketch map that this is extremely rugged terrain. Elevations rise from sea level to over 2000 feet in half a mile, a slope of nearly 45 degrees in places. |
References
Don J. Miller, 1960; Giant Waves in Lituya Bay, Alaska, U.S. Geological Survey Professional Paper 354-C, 86 p. Good luck finding this. It tends to disappear from libraries. I bought what may have been the last available copy.
Return to Earth Science Notes Index
Return to Physical Geology Notes Index
Return to Professor Dutch's home page
Created February 3, 1997, Last Update 23 January 2001
Not an Official UW-Green Bay Site