U.S. Daily High Temperature Extremes
Steven Dutch, Professor Emeritus, Natural and Applied Sciences, Universityof Wisconsin - Green Bay
General Comments
An astonishing 97% of national highs occur in just four states: Florida, Texas, Arizona, and California. A single station, Death Valley, accounted for 1022 highs or almost 19% of the total, and the top ten stations accounted for half of all readings. After Florida, with 1005 records, the state with the next largest number of highs is Nevada, with 44. Altogether there were 313 localities represented.
Death Valley posted only one nationwide high in December, January and February and only four in November, but posted national highs on every calendar date from April 23 to October 20.
Below are the top twenty stations:
1022 Death Valley CA
298 Laredo TX
266 McAllen TX
264 Lake Havasu City AZ
216 Coolidge AZ
206 Thermal CA
192 Bullhead City AZ
182 Fort Myers FL
137 Lajitas TX
133 Gila Bend AZ
129 Wink TX
92 Harlingen TX
75 Pembroke Pines FL
71 McAllen TX
71 Alice TX
62 Naples FL
60 Presidio TX
58 Miami FL
56 Imperial CA
General Patterns

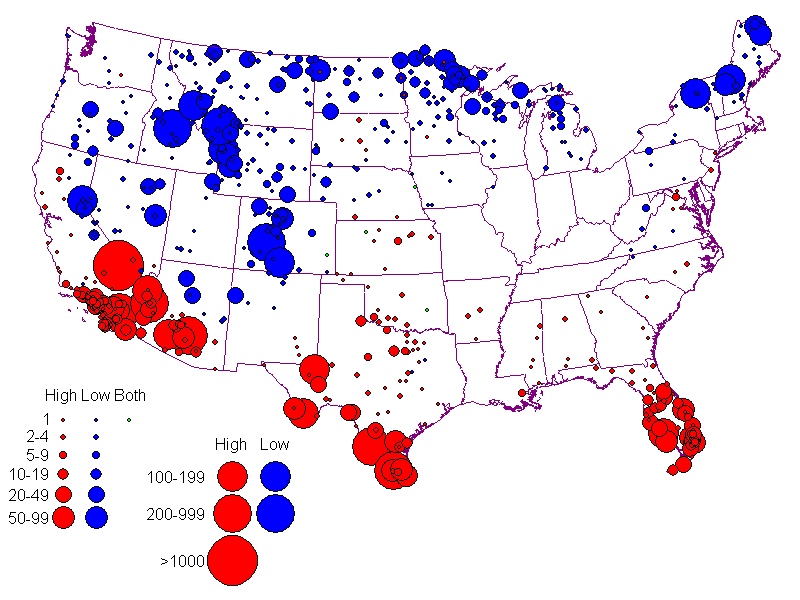
This map shows the frequency of records by station. Note the dominance of Florida, Texas, Arizona and California for highs.
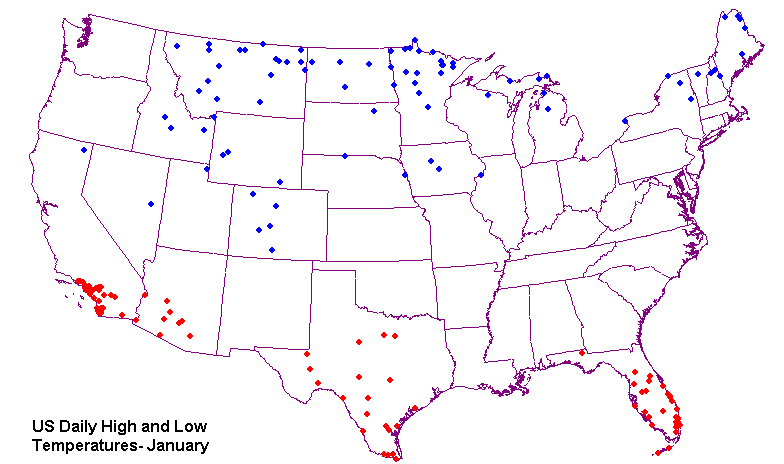
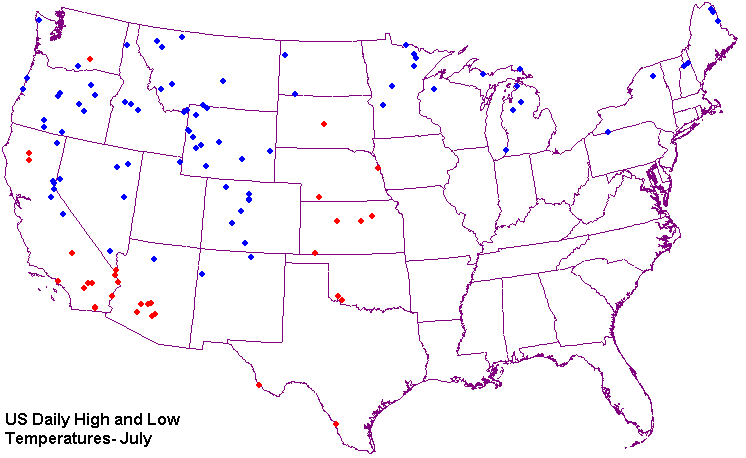
The maps below show highs and lows for January and July.

The pattern for January shows a fairly even distribution of highs across the Big Four states

By July, highs are virtually absent from Texas and Florida (not that it can't get awfully hot in both places) and a scattering of highs occurs to the north, especially in the Plains states. Note that inland stations dominate in California, whereas coastal stations dominated in January.

The bar graph above shows seasonal distribution of national highs. Note that California and Arizona dominate the summer months while Texas and Florida dominate the winter. Texas is also strongly represented in late spring. There are no months with completely uniform distribution though March and November come closest.
Florida shows a very similar pattern to Hawaii. There are few highs in May, none at all recorded from June 12 to October 23. However, Florida posted a national high on every calendar date from November 23 to March 11. The reason seems to be the same as Hawaii's: Florida's subtropical latitude and maritime climate dominate during the winter months when cooling of the continental land mass affects California and Arizona, but during the summer, continental heating completely overwhelms the national highs.

The map above shows national highs by month and state. The scales for each state are proportional for that state and do not reflect absolute numbers. Several patterns can be seen.
- Florida's highs are restricted to the winter months
- Texas shares the winter records with Florida but dominates in April and May
- California and Arizona own the summer.
- The southeast and Atlantic seaboard states are most likely to post national records in the spring.
- The Plains states are most likely to post national records in the summer and fall.
- Some patterns are due to chance. Highs are so sporadic outside the Big Four states that chance occurrences may skew the record. For example, there is a single high in Washington but none in Oregon. It seems likely that a longer series of observations would show highs in Oregon as well.
- On the other hand, temperature extremes in states that rarely have them are quite unlikely to be climatologically unusual as well. We can be reasonably sure nationwide highs are more likely to occur in Minnesota and North Dakota in June than, say, October.

The graph above shows national highs by date. The curve is a pretty well behaved sine curve, though there is a hint that the summer peak is a little sharper than the winter trough. The scatter is quite uniform throughout the year, averaging about 20 degrees.
U.S. Daily Temperature Extremes
U.S. Daily Lows
Return to Professor Dutch's Home Page
Created 27 December 2006, Last Update 24 May 2020