U.S. Daily Low Temperature Extremes
Steven Dutch, Professor Emeritus, Natural and Applied Sciences, Universityof Wisconsin - Green Bay
General Comments
Lows are more widely distributed than highs. Of the 4845 records, thirteen states have over 100. The top four states, Montana, Idaho, Colorado and Minnesota, account for only half of the total in contrast to the pattern for highs where the top four states account for 97%. Below are occurrences by month and state, alphabetically and by decreasing record count.
| Month | AZ | CA | CO | IA | ID | IL | KS | MA | ME | MI | MN | MT | NC | ND | NE | NH | NM | NV | NY | OR | PA | SD | TX | UT | VA | VT | WA | WI | WV | WY |
| Jan | 0 | 1 | 57 | 2 | 5 | 1 | 38 | 8 | 82 | 67 | 25 | 2 | 16 | 2 | 29 | 3 | 2 | 1 | 1 | 12 | ||||||||||
| Feb | 1 | 3 | 38 | 0 | 10 | 46 | 15 | 80 | 53 | 14 | 30 | 1 | 28 | 2 | 5 | 27 | ||||||||||||||
| Mar | 4 | 1 | 10 | 2 | 20 | 1 | 36 | 48 | 81 | 67 | 21 | 3 | 24 | 2 | 3 | 29 | 1 | 2 | 2 | 1 | 9 | 1 | 28 | |||||||
| Apr | 11 | 23 | 33 | 0 | 21 | 14 | 24 | 39 | 62 | 16 | 6 | 16 | 10 | 9 | 17 | 8 | 1 | 7 | 3 | 6 | 1 | 49 | ||||||||
| May | 22 | 24 | 56 | 0 | 48 | 6 | 27 | 35 | 58 | 13 | 5 | 20 | 9 | 24 | 11 | 18 | 1 | 3 | 6 | 9 | 2 | 50 | ||||||||
| Jun | 37 | 47 | 42 | 0 | 92 | 5 | 5 | 15 | 41 | 4 | 11 | 5 | 11 | 3 | 37 | 2 | 2 | 6 | 1 | 2 | 1 | 51 | ||||||||
| Jul | 8 | 76 | 39 | 0 | 101 | 6 | 13 | 12 | 49 | 2 | 13 | 3 | 8 | 7 | 42 | 2 | 3 | 3 | 1 | 50 | ||||||||||
| Aug | 1 | 71 | 22 | 0 | 124 | 9 | 3 | 12 | 87 | 1 | 1 | 6 | 7 | 4 | 39 | 1 | 1 | 4 | 34 | |||||||||||
| Sep | 1 | 28 | 34 | 0 | 70 | 7 | 16 | 31 | 97 | 1 | 5 | 14 | 14 | 8 | 19 | 1 | 9 | 1 | 1 | 10 | 48 | |||||||||
| Oct | 2 | 17 | 77 | 1 | 46 | 1 | 4 | 8 | 19 | 74 | 15 | 2 | 19 | 4 | 21 | 7 | 15 | 4 | 4 | 3 | 3 | 5 | 5 | 57 | ||||||
| Nov | 0 | 5 | 77 | 1 | 19 | 18 | 7 | 55 | 94 | 26 | 3 | 6 | 5 | 6 | 10 | 7 | 6 | 2 | 1 | 48 | ||||||||||
| Dec | 3 | 2 | 78 | 0 | 7 | 19 | 13 | 88 | 85 | 21 | 1 | 12 | 4 | 23 | 1 | 1 | 4 | 5 | 14 | 23 | ||||||||||
| Tot | 90 | 298 | 563 | 6 | 563 | 1 | 1 | 1 | 208 | 187 | 549 | 834 | 2 | 163 | 22 | 187 | 38 | 110 | 176 | 187 | 8 | 31 | 2 | 44 | 3 | 2 | 9 | 67 | 10 | 477 |
| % | 1.9% | 6.2% | 11.6% | 0.1% | 11.6% | 0.0% | 0.0% | 0.0% | 4.3% | 3.9% | 11.3% | 17.2% | 0.0% | 3.4% | 0.5% | 3.9% | 0.8% | 2.3% | 3.6% | 3.9% | 0.2% | 0.6% | 0.0% | 0.9% | 0.1% | 0.0% | 0.2% | 1.4% | 0.2% | 9.9% |
| Month | MT | ID | CO | MN | WY | CA | ME | MI | NH | OR | NY | ND | NV | AZ | WI | UT | NM | SD | NE | WV | WA | PA | IA | VA | NC | TX | VT | IL | KS | MA |
| Jan | 67 | 5 | 57 | 82 | 12 | 1 | 38 | 8 | 16 | 29 | 25 | 2 | 0 | 1 | 2 | 3 | 2 | 2 | 1 | 1 | ||||||||||
| Feb | 53 | 10 | 38 | 80 | 27 | 3 | 46 | 15 | 30 | 28 | 14 | 1 | 1 | 5 | 2 | 0 | ||||||||||||||
| Mar | 67 | 20 | 10 | 81 | 28 | 1 | 36 | 48 | 24 | 1 | 29 | 21 | 3 | 4 | 9 | 1 | 2 | 2 | 3 | 1 | 2 | 2 | 1 | |||||||
| Apr | 62 | 21 | 33 | 39 | 49 | 23 | 14 | 24 | 16 | 8 | 17 | 16 | 9 | 11 | 6 | 3 | 10 | 7 | 6 | 1 | 1 | 0 | ||||||||
| May | 58 | 48 | 56 | 35 | 50 | 24 | 6 | 27 | 20 | 18 | 11 | 13 | 24 | 22 | 9 | 6 | 9 | 3 | 5 | 2 | 1 | 0 | ||||||||
| Jun | 41 | 92 | 42 | 15 | 51 | 47 | 5 | 5 | 11 | 37 | 3 | 4 | 11 | 37 | 2 | 6 | 5 | 2 | 1 | 1 | 2 | 0 | ||||||||
| Jul | 49 | 101 | 39 | 12 | 50 | 76 | 6 | 13 | 13 | 42 | 7 | 2 | 8 | 8 | 1 | 3 | 3 | 3 | 2 | 0 | ||||||||||
| Aug | 87 | 124 | 22 | 12 | 34 | 71 | 9 | 3 | 6 | 39 | 4 | 1 | 7 | 1 | 4 | 1 | 1 | 0 | 1 | |||||||||||
| Sep | 97 | 70 | 34 | 31 | 48 | 28 | 7 | 16 | 14 | 19 | 8 | 5 | 14 | 1 | 10 | 9 | 1 | 1 | 0 | 1 | 1 | |||||||||
| Oct | 74 | 46 | 77 | 19 | 57 | 17 | 4 | 8 | 19 | 15 | 7 | 15 | 21 | 2 | 5 | 4 | 4 | 4 | 2 | 5 | 3 | 1 | 3 | 1 | ||||||
| Nov | 94 | 19 | 77 | 55 | 48 | 5 | 18 | 7 | 6 | 7 | 10 | 26 | 6 | 0 | 1 | 2 | 5 | 6 | 3 | 1 | ||||||||||
| Dec | 85 | 7 | 78 | 88 | 23 | 2 | 19 | 13 | 12 | 1 | 23 | 21 | 4 | 3 | 14 | 5 | 4 | 1 | 1 | 0 | ||||||||||
| Tot | 834 | 563 | 563 | 549 | 477 | 298 | 208 | 187 | 187 | 187 | 176 | 163 | 110 | 90 | 67 | 44 | 38 | 31 | 22 | 10 | 9 | 8 | 6 | 3 | 2 | 2 | 2 | 1 | 1 | 1 |
| % | 17.2% | 11.6% | 11.6% | 11.3% | 9.9% | 6.2% | 4.3% | 3.9% | 3.9% | 3.9% | 3.6% | 3.4% | 2.3% | 1.9% | 1.4% | 0.9% | 0.8% | 0.6% | 0.5% | 0.2% | 0.2% | 0.2% | 0.1% | 0.1% | 0.0% | 0.0% | 0.0% | 0.0% | 0.0% | 0.0% |
| Cum% | 17.2% | 28.9% | 40.5% | 51.8% | 61.7% | 67.9% | 72.2% | 76.0% | 79.9% | 83.8% | 87.4% | 90.8% | 93.0% | 94.9% | 96.3% | 97.2% | 98.0% | 98.6% | 99.1% | 99.3% | 99.5% | 99.6% | 99.8% | 99.8% | 99.9% | 99.9% | 99.9% | 100.0% | 100.0% | 100.0% |
Below are the top twenty stations:
497 Stanley ID
394 West Yellowstone WY
207 Gunnison CO
186 Truckee CA
150 Alamosa CO
136 Saranac Lake NY
119 Wisdom MT
108 Jackson WY
104 Berlin NH
98 Fraser CO
89 Bondurant WY
88 Ely NV
85 Presque Isle ME
81 Whitefield NH
74 Big Piney WY
72 Houlton ME
71 International Falls MN
61 Embarrass MN
52 Williston ND
The reason Stanley, Idaho doesn't enjoy(?) the frigid reputation of International Falls, Minnesota is that its lows occur mostly during the summer months.
Note the large number of records, mostly summer, for Truckee, California. Between Truckee and Death Valley, it is fairly common for California to have the national high and low on the same day.
General Patterns

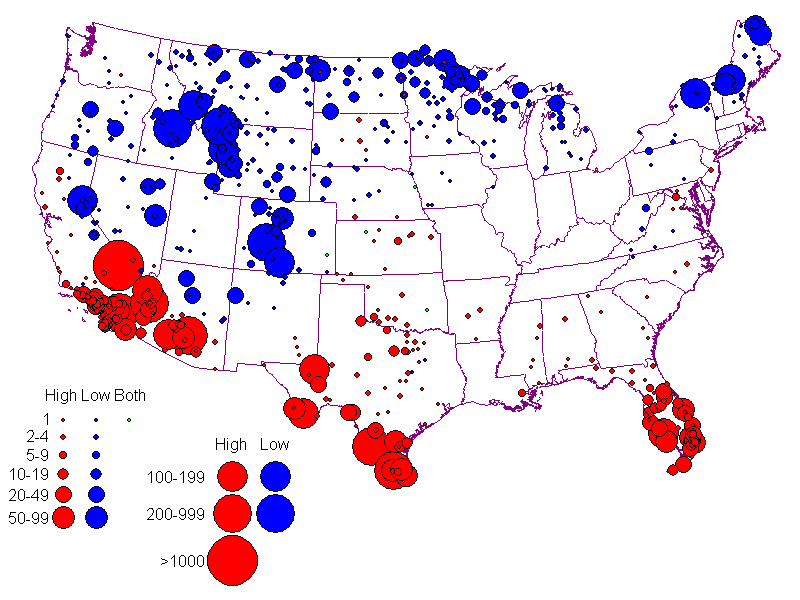
This map shows the frequency of records by station. Note the dominance of states along the Canadian border and the Rockies.
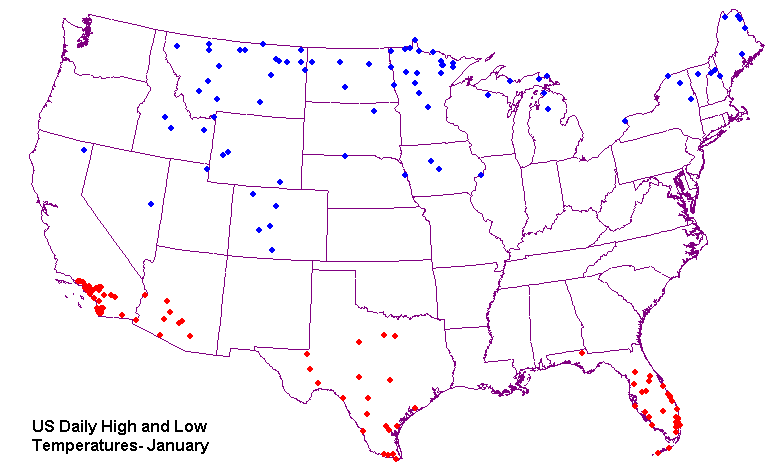
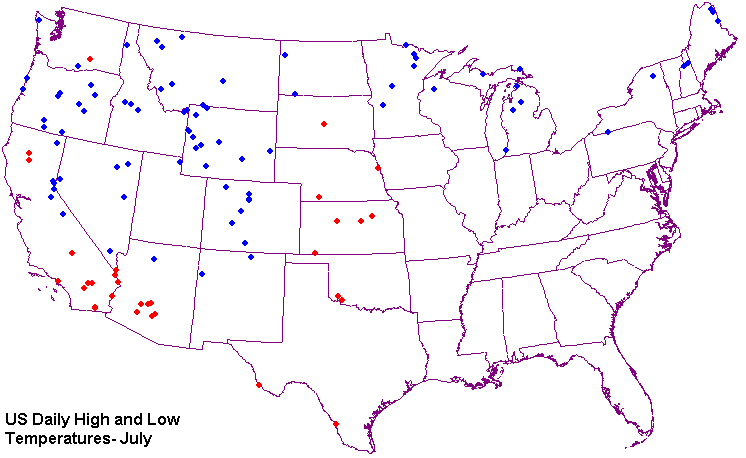
The maps below show highs and lows for January and July.

The pattern for January shows the expected dominance of the "cold belt" states and the Rockies. Incursions of cold air masses push records as far south as Nebraska and Iowa.

By July, lows are more likely to occur in the mountain states. They have spread south into the Colorado Plateau and west to the Pacific Northwest.

The bar graph above shows seasonal distribution of national lows. There are three main groups of states. Montana, Colorado, and Wyoming show the most consistent occurrence year-round, with Montana having the most uniform distribution. Minnesota, Michigan, Maine, North Dakota, New York, and New Hampshire dominate the winter months, and Arizona, Oregon and Idaho dominate the summer months. Nevada has a strong summer presence but actually peaks in spring and fall.

The map above shows national highs by month and state. The scales for each state are proportional for that state and do not reflect absolute numbers. Several patterns can be seen.
- The "cold belt" states dominate the winter lows.
- Lows in the Appalachian states tend to occur in the fall, probably due to local orographic effects like cold air drainage.
- Lows in the central plains occur in the spring.
- The mountain states are most likely to post records in the summer, probably a combination of high altitude, clear skies (for radiational cooling) and low humidity (no moist greenhouse effect).
- Montana appears to owe its prominence to geography. The High Plains experience Arctic winter outbursts in the winter while the mountains post lows in the summer. Furthermore, its enormous size gives it a high probability of seeing a record.
- Some patterns are due to chance. Lows are so sporadic in some states that chance occurrences may skew the record. For example, there is a single low in Kansas, two in Texas but none in Oklahoma. It seems likely that a longer series of observations would show lows in Oklahoma as well.

The graph above shows national lows by date. The curve is a strangely disjointed one. The scatter from November to March is much greater than the rest of the year. Furthermore, the curve seems to show a fairly linear increase from March to July, a sharp peak, and a linear decrease from then until the end of October.
U.S. Daily Highs
U.S. Daily Temperature Extremes
Return to Professor Dutch's Home Page
Created 27 December 2006, Last Update 24 May 2020